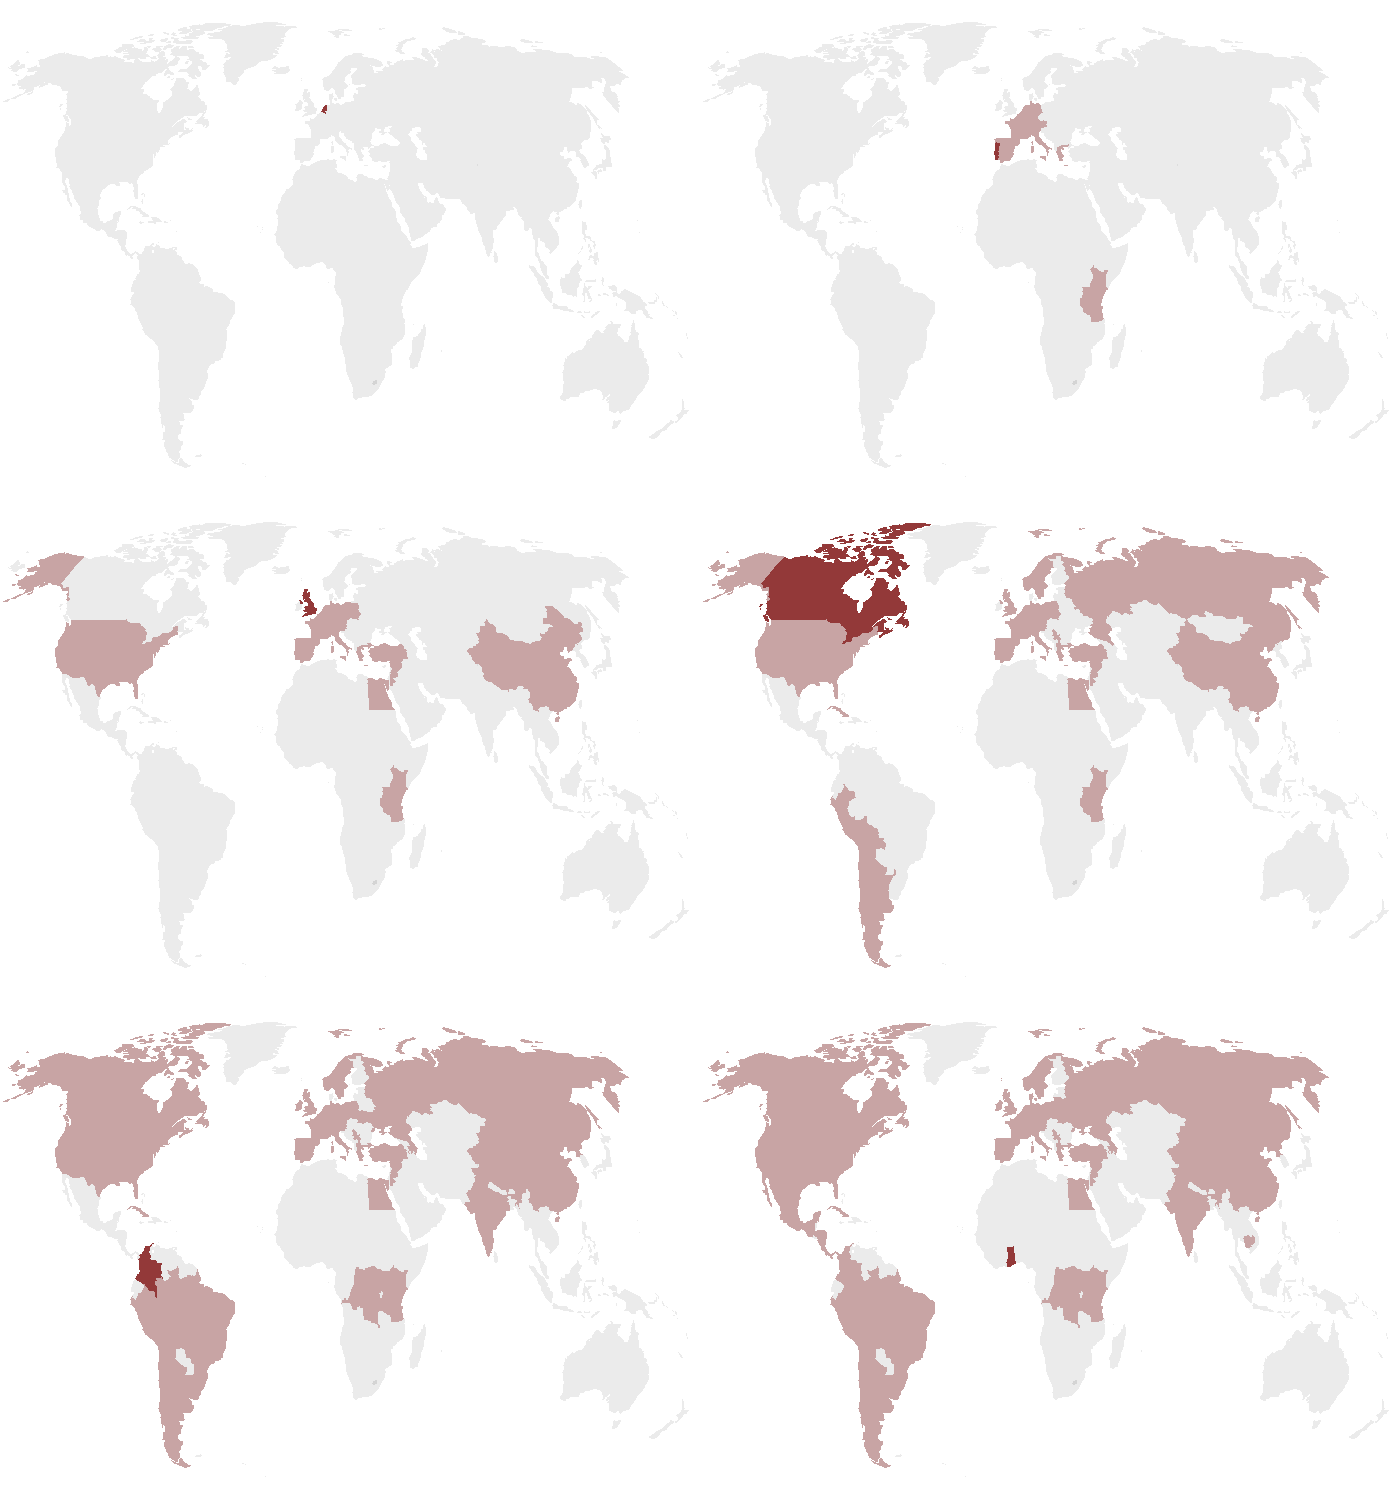
Countries Visited Animated GIF
Introduction
Since I am planning on using some gg_animate gifs for my thesis, it seemed like a good idea to start with a small project. This gif shows the countries I have visited thus far in order (or so I think, I haven’t gone through the photo albums yet). A lot of the code was inspired by this Github page. However, I did use the latest gg_animate grammar. Countries that I visited more than once, only show up the first time I visited them.
Packages
These are the R packages I used:
library(curl)
library(readxl)
library(data.table)
library(rworldmap)
library(ggplot2)
library(dplyr)
library(tweenr)
library(ggthemes)
library(rgeos)
library(countrycode)
library(gganimate)
library(knitr)
library(kableExtra)
Data
I created an Excel file with all countries in the world, which can be easily found on the internet. I just used the file used in above-mentioned Github page and cleaned that. Then I added an extra column with the order of which I visited the countries. Maybe, if I feel like it, I will update it and also add dates/years later. This is how the data then looks likes:
df <- read_excel(path= "countries_in order.xlsx", sheet=1)
df%>%
  head(13)%>%
  kable()%>%
  kable_styling(bootstrap_options =  c("striped", "hover", "condensed", "responsive"),
                full_width = F,
                position = "left")
| Country | visit |
|---|---|
| Burundi | NA |
| Comoros | NA |
| Djibouti | NA |
| Eritrea | NA |
| Ethiopia | NA |
| Kenya | 12 |
| Madagascar | NA |
| Malawi | NA |
| Mauritius | NA |
| Mayotte | NA |
| Mozambique | NA |
| Réunion | NA |
| Rwanda | 45 |
Data manipulation
First we add the ISO3 code to the data
setDT(df)
df[, country_iso3c := countrycode(Country, 'country.name', 'iso3c')]
Now we load the map and create the data.table we need for the polygon plotting in ggplot2.
wmap <- getMap()
wmap <- spTransform(wmap, CRS("+proj=robin")) # reproject
wmap <-   subset(wmap, !(NAME %like% "Antar")) # Remove Antarctica
wmap_df <- fortify(wmap, region = "ISO3")
wmap_df <- left_join(wmap_df, df, by = c('id'='country_iso3c'))
In order to add a grey background, that is not influenced by the animation, I simply duplicated the data.table and added a postscript to the variable names.
wmap_df2 <- wmap_df
colnames(wmap_df2) <- paste(colnames(wmap_df2), "2", sep = "_")
Make the plot
p <- ggplot() +
  geom_polygon(data = wmap_df,
               aes(x = long,
                   y = lat,
                   group = group),
               fill="#800000")+
  geom_polygon(data = wmap_df2, # this is the background map, that is not influenced by the animated part of the gif
               aes(x = long_2,
                   y = lat_2,
                   group = group_2),
               fill="grey",
               alpha=.3)+
  theme_void() +
  coord_cartesian(xlim = c(-11807982, 14807978)) +
  transition_manual(visit)+
  shadow_trail(distance = 0.01, alpha=.4) # add a small number for distance, to make all visited countries show.
Make and save the animation
This code is used to render and then save the GIF.
animate(p, duration=30)

anim_save("countries_visited.gif", animation = p, duration =30)